
Low Response Does Not Always Mean Low Demand
Limited access can make a viable market look quiet. Before you cut a low-response market from the plan, run this second test, it may be the cheapest growth you have.
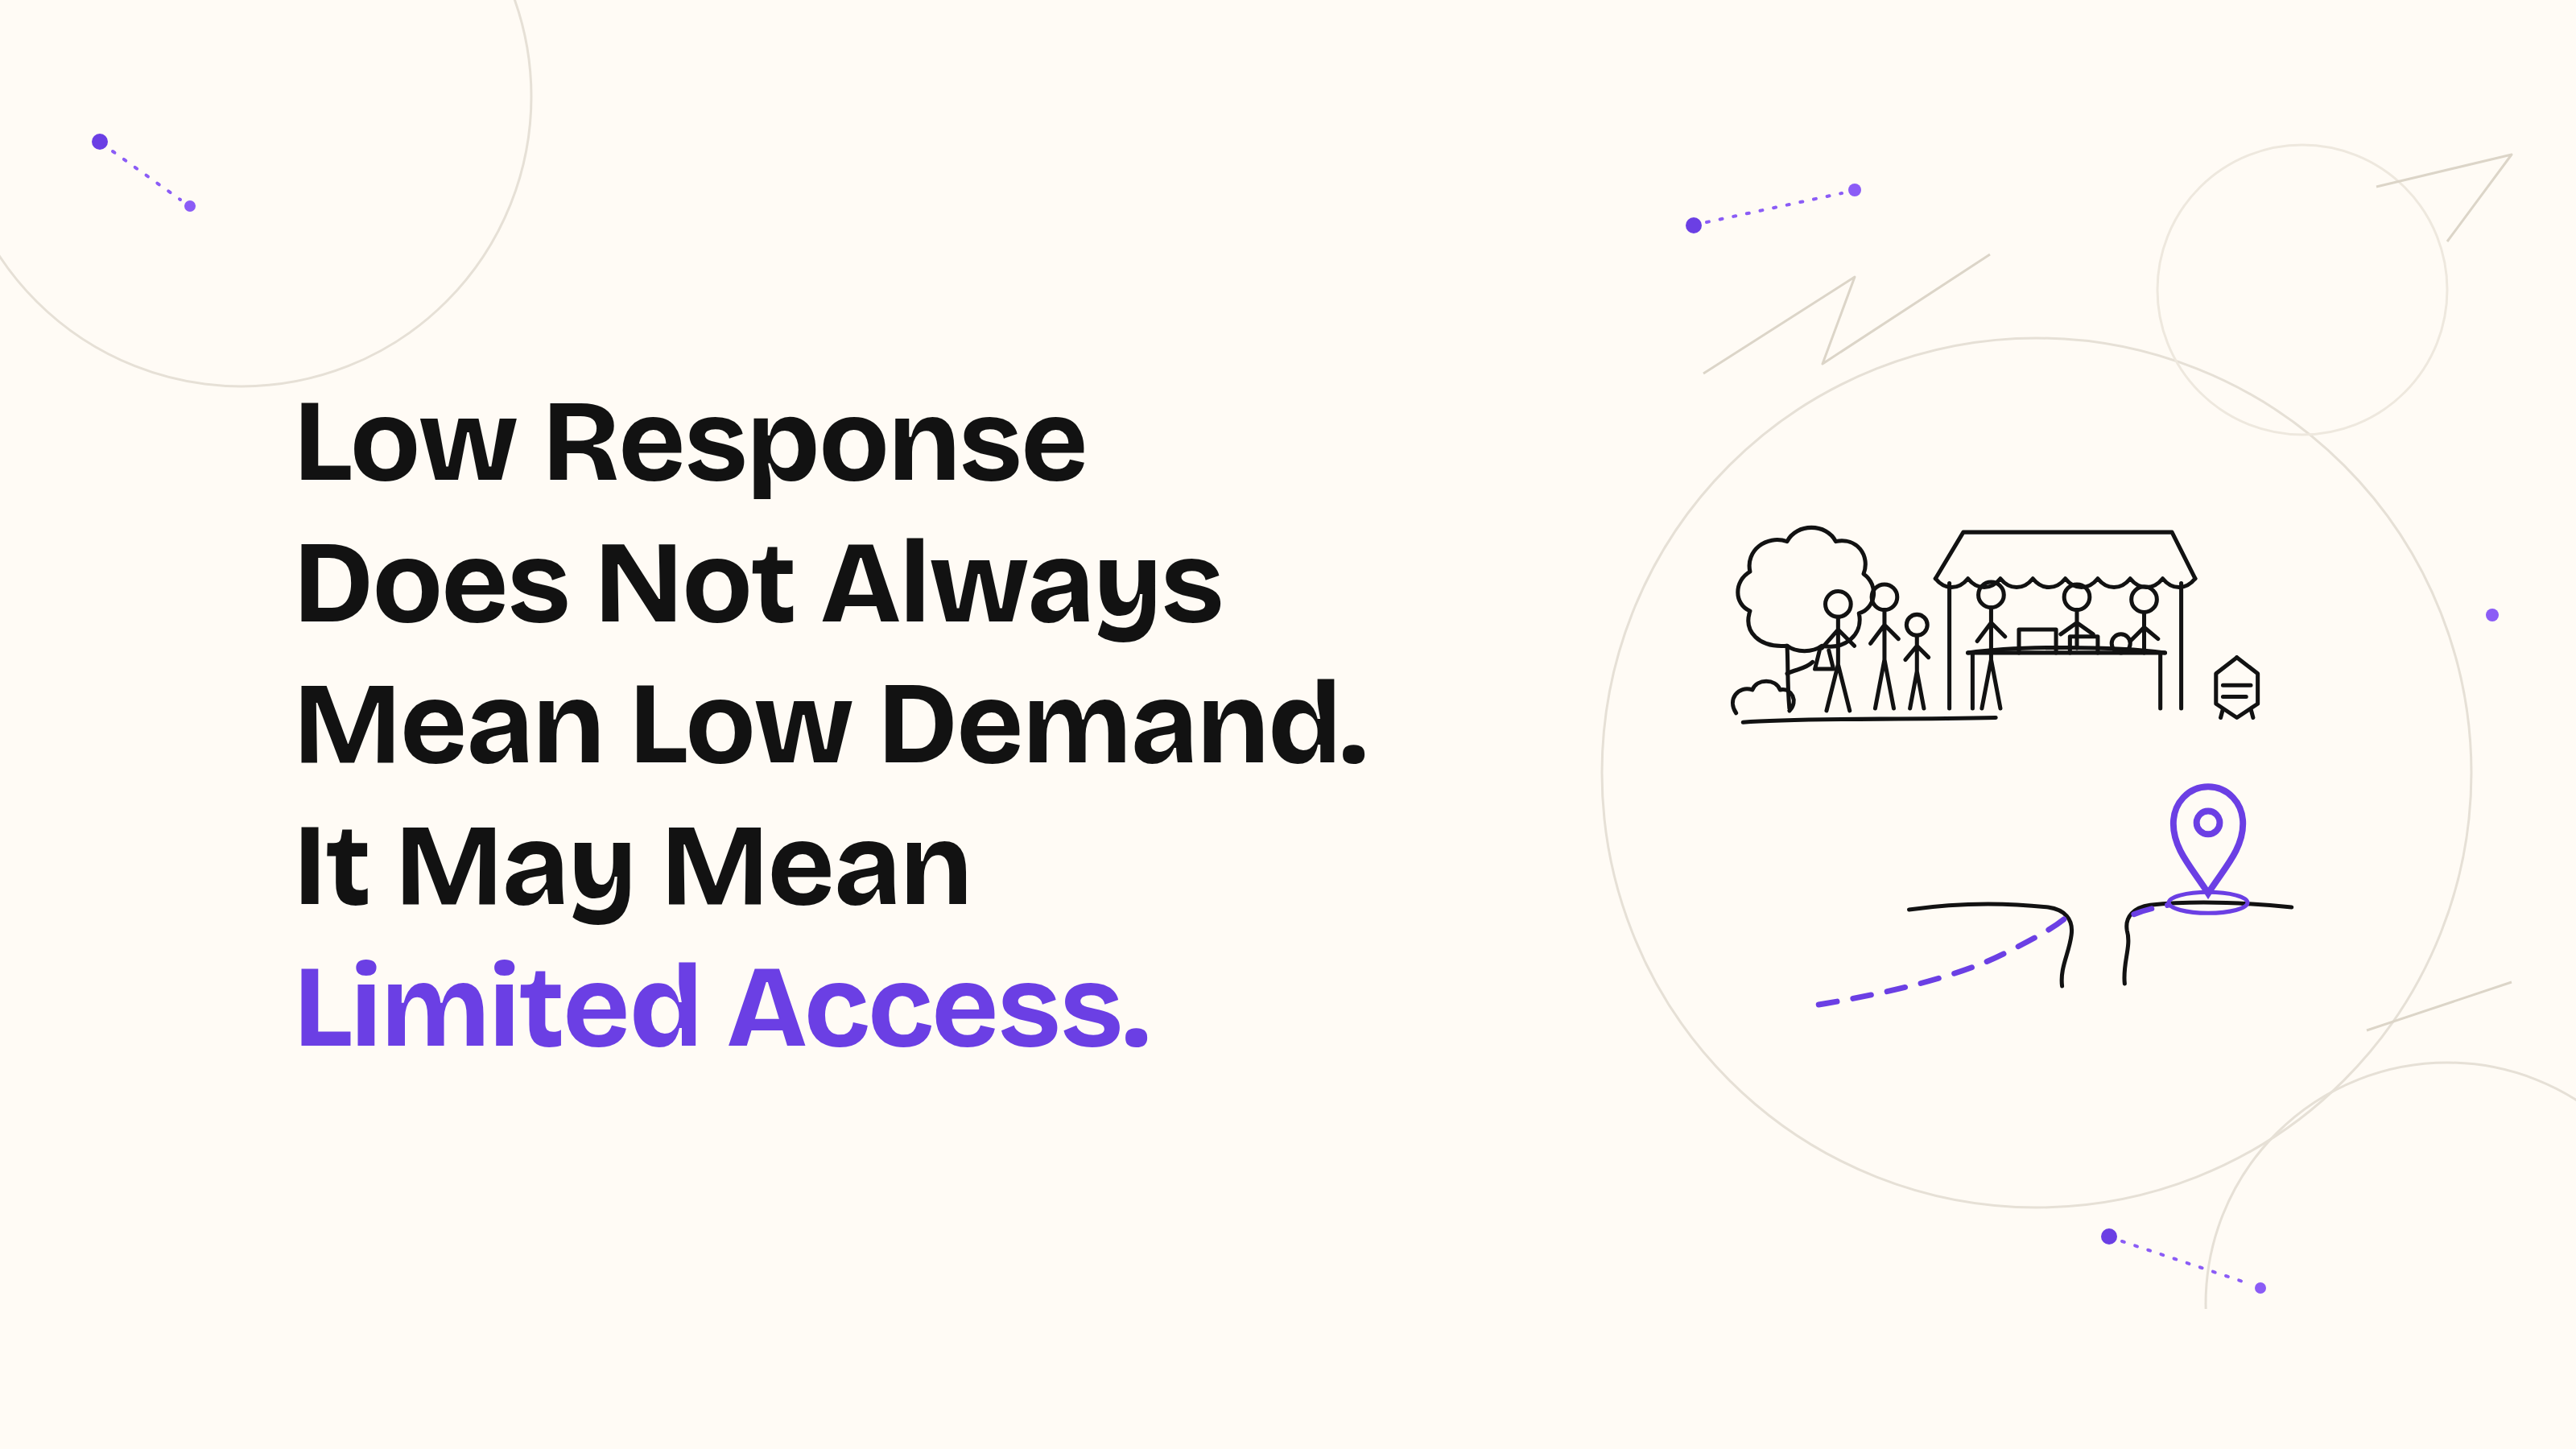
Limited access can make a viable market look quiet. Here is a second test to run before you cut a market from the plan.
We have made this argument before: your customer data is a map of your footprint, not your market.
In townships, informal trading corridors and migrant markets, the gap between those two maps is often at its widest, because much of the data needed to reveal the full market has never been collected.
The decision on the table
Financial-services teams use applications, transactions, visits and account openings to decide where to place agents, counters, merchant devices and acquisition teams. Those signals matter. But they are shaped by the network already in place.
A market with convenient access has more chances to respond. A market without it can look quiet even when the right customers are there.
So when a low-response market comes up for exclusion, the honest question is not “is the number low?” It is: is the number describing weak demand, or weak access?
Cut the market on the first reading and you may be cutting the cheapest growth you have. Keep pouring resources into high-response markets and you may be paying to duplicate coverage you already own, agents into saturated catchments, devices where devices already are, acquisition spend chasing familiar activity instead of incremental opportunity.
Sometimes the issue is not the team, the product or the budget. It is placement.
The second test
Low response does not automatically make a market attractive. It also should not remove that market from consideration. Before excluding it, put the number next to independent evidence of local opportunity:
- Is there a relevant customer catchment? Not who sleeps there but who is economically present there.
- How do people move through the area? Taxi routes, commuter corridors, the difference between a quiet residential map and a dense daytime trading zone.
- Where does commercial activity already happen? Markets, high streets, trading clusters, the places transactions want to occur.
- What access already exists, yours and competitors’? A quiet area next to a rival’s active agent network reads very differently from a quiet area no one has entered.
- Would the proposed channel actually be convenient? An agent nobody passes is a cost, not coverage.
Together these give you two views: current performance and local opportunity. Neither answers the question on its own.
Two markets, one budget
An illustration, not a customer result.
Market A produces 500 applications. It already has several agents and a nearby service point. Market B produces 250 applications, has almost no access, strong commuter movement and a dense cluster of relevant local merchants.
On applications alone, the next agent goes to Market A. But Market A’s number is partly a record of the access you already built there, the loop from the first article, running live. Market B’s lower number may reflect nothing more than the absence of a practical way to respond.
That does not prove Market B will succeed. It proves Market B has not yet been tested, and that testing it is cheaper than continuing to reinforce a catchment you already saturate.
Use each map for what it can show
Keep the historical data. It is the right tool for understanding existing performance, customer behaviour and channel productivity.
Then add the second lens before the money moves: who lives and works nearby, how people move, where commercial activity concentrates, what access already exists, and whether new access would be convenient.
Before committing the next agent, counter or device, ask one question of every excluded market:
Are we cutting this market because demand is weak, or because customers have never had a practical way to respond?
If your team is facing a live distribution decision, bring us one territory. Book a 25-minute walkthrough in which we’ll put your current response data next to field-verified evidence of local opportunity, catchment, movement, commercial activity, existing access, and show you where verification could change the decision before resources are committed.
Timbuk2 helps organisations confidently decide where to deploy people, capital and infrastructure by revealing the market beyond their existing footprint.